Rebel Data Outlier
$20.00 – $100.00” We’ve got a nice looking trend line here- I’d like to thank the entire team for contributing this data, including Gerald, for the outlier.”
Showing 41–59 of 59 results
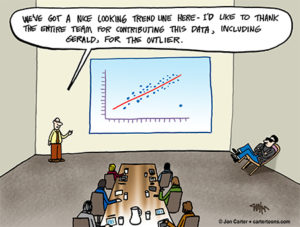
” We’ve got a nice looking trend line here- I’d like to thank the entire team for contributing this data, including Gerald, for the outlier.”
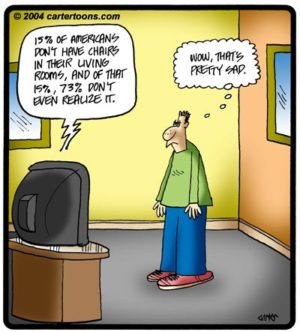
15% of Americans don’t have chairs in their living rooms, and of that 15%, 73% don’t even realize it.
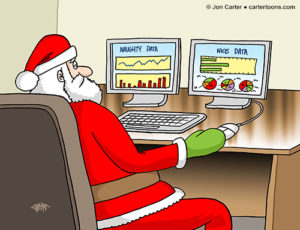
Cartoon showing Santa sitting at his desk with two computer monitors, one says ‘naughty data,’ and the other says ‘nice data.’
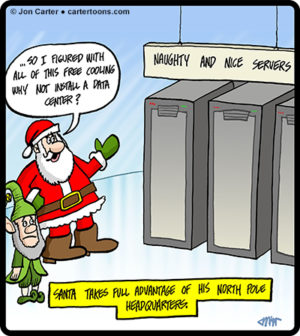
So I figured with all of this free cooling why not install a data center. Naughty and nice servers. Santa takes full advantage of his north pole headquarters.
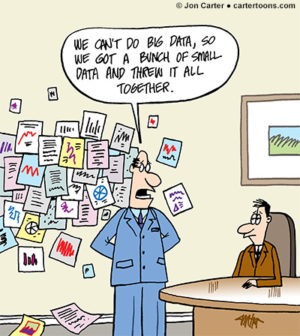
We can’t do big data, so we got a bunch of small data and threw it all together.
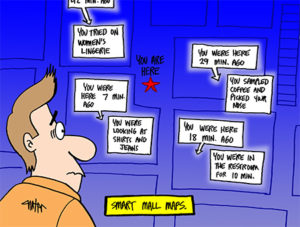
Smart mall map knows all activity of man looking at it.
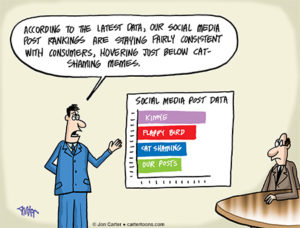
“According to the latest data, our social media post rankings are staying fairly consistent with consumers, hovering just below cat-shaming memes.”
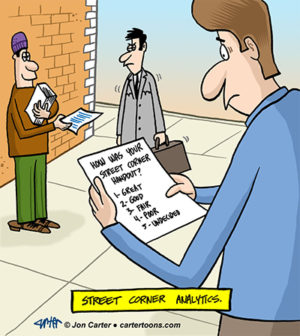
Man on street corner handing out customer feedback sheets. Street corner analytics.
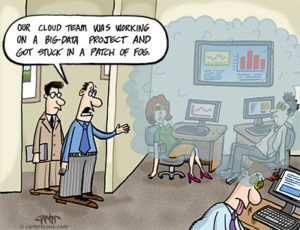
“Our cloud team was working on a big-data project and got stuck in a patch of fog.”
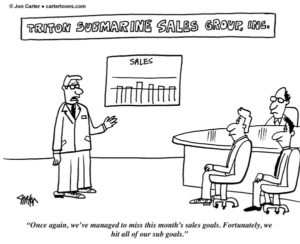
Once again, we’ve managed to miss this month’s sales goals. Fortunately, we hit all of our sub goals.
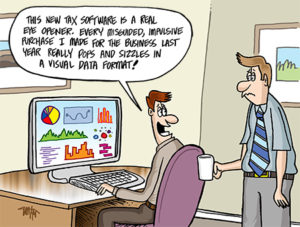
“This new tax software is a real eye opener. Every misguided, impulsive purchase I made for the business last year really pops and sizzles in a visual data format!”
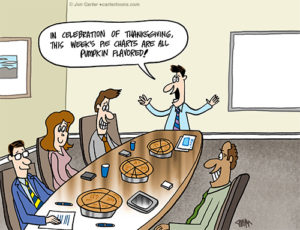
“In celebration of Thanksgiving, this week’s pie charts are all pumpkin flavored!”
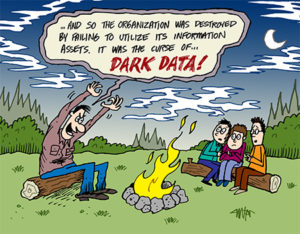
“… And so the organization was destroyed by failing to utilize its information assets. It was the curse of … DARK DATA!”
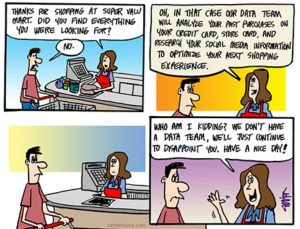
Man and woman discuss customer shopping experience with no data team.

Every time I click ‘accept’ for these online user agreements, a piece of my soul dies.
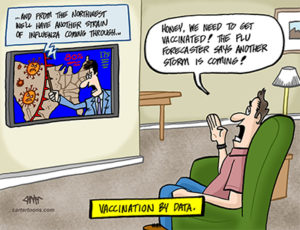
“Honey, we need to get vaccinated! The flu forecaster says another storm is coming!”
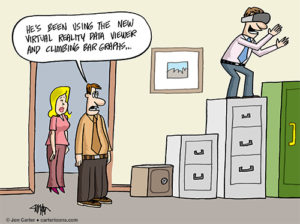
“He’s been using the new virtual reality data viewer and climbing bar graphs…”
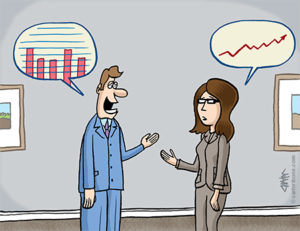
Business man and woman speaking two different visual data formats.
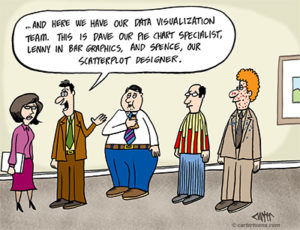
“… And here we have our data visualization team. This is Dave our pie chart specialist, Lenny in bar graphics, and Spence, our scatterplot designer.”